mathematical foundation of log derivatives
general formula for log derivative of a binding network, and dominance decomposition tree (DTT) to directly obtain log derivative polyhedra.
\( \newcommand{\Id}{\mathbf{I}} \newcommand{\R}{\mathbb{R}} \newcommand{\C}{\mathbb{C}} \newcommand{\N}{\mathbb{N}} \newcommand{\Z}{\mathbb{Z}} \newcommand{\Prob}[1]{\operatorname{\mathbb{P}} \left { #1 \right } } \newcommand{\E}[1]{\operatorname{\mathbb{E}} \left { #1 \right } } \newcommand{\Expect}{\operatorname{\mathbb{E}}} \newcommand{\Var}[1]{\operatorname{\mathrm{Var}} \left { #1 \right } } \newcommand{\I}[1]{\operatorname{\mathbb{1}} \left { #1 \right } } \newcommand{\Cov}[1]{\operatorname{\mathrm{Cov}} \left ( #1 \right ) } \newcommand{\vc}[1]{\bm{#1}} \newcommand{\mt}[1]{\bm{#1}} \newcommand{\range}{\operatorname{range}} \newcommand{\image}{\operatorname{im}} \newcommand{\rank}{\operatorname{rank}} \newcommand{\nullity}{\mathrm{nullity}} \newcommand{\ip}[1]{\left \langle #1 \right \rangle } \newcommand{\eigenvalue}{\operatorname{eigenvalue}} \newcommand{\tr}{\operatorname{tr}} \newcommand{\spn}[1]{\mathrm{span}\left {#1\right }} \newcommand{\im}{\operatorname{im}} \newcommand{\diag}{\operatorname{diag}} \newcommand{\norm}[1]{\left\lVert#1\right\rVert} \newcommand{\abs}[1]{\left \lvert #1 \right \rvert} \newcommand{\sgn}{\operatorname{sgn}} \newcommand{\tran}{\intercal} \newcommand{\conv}[1]{\mathrm{conv}\left {#1\right }} \) This is joint work with Daniele Capelletti and John P Marken.
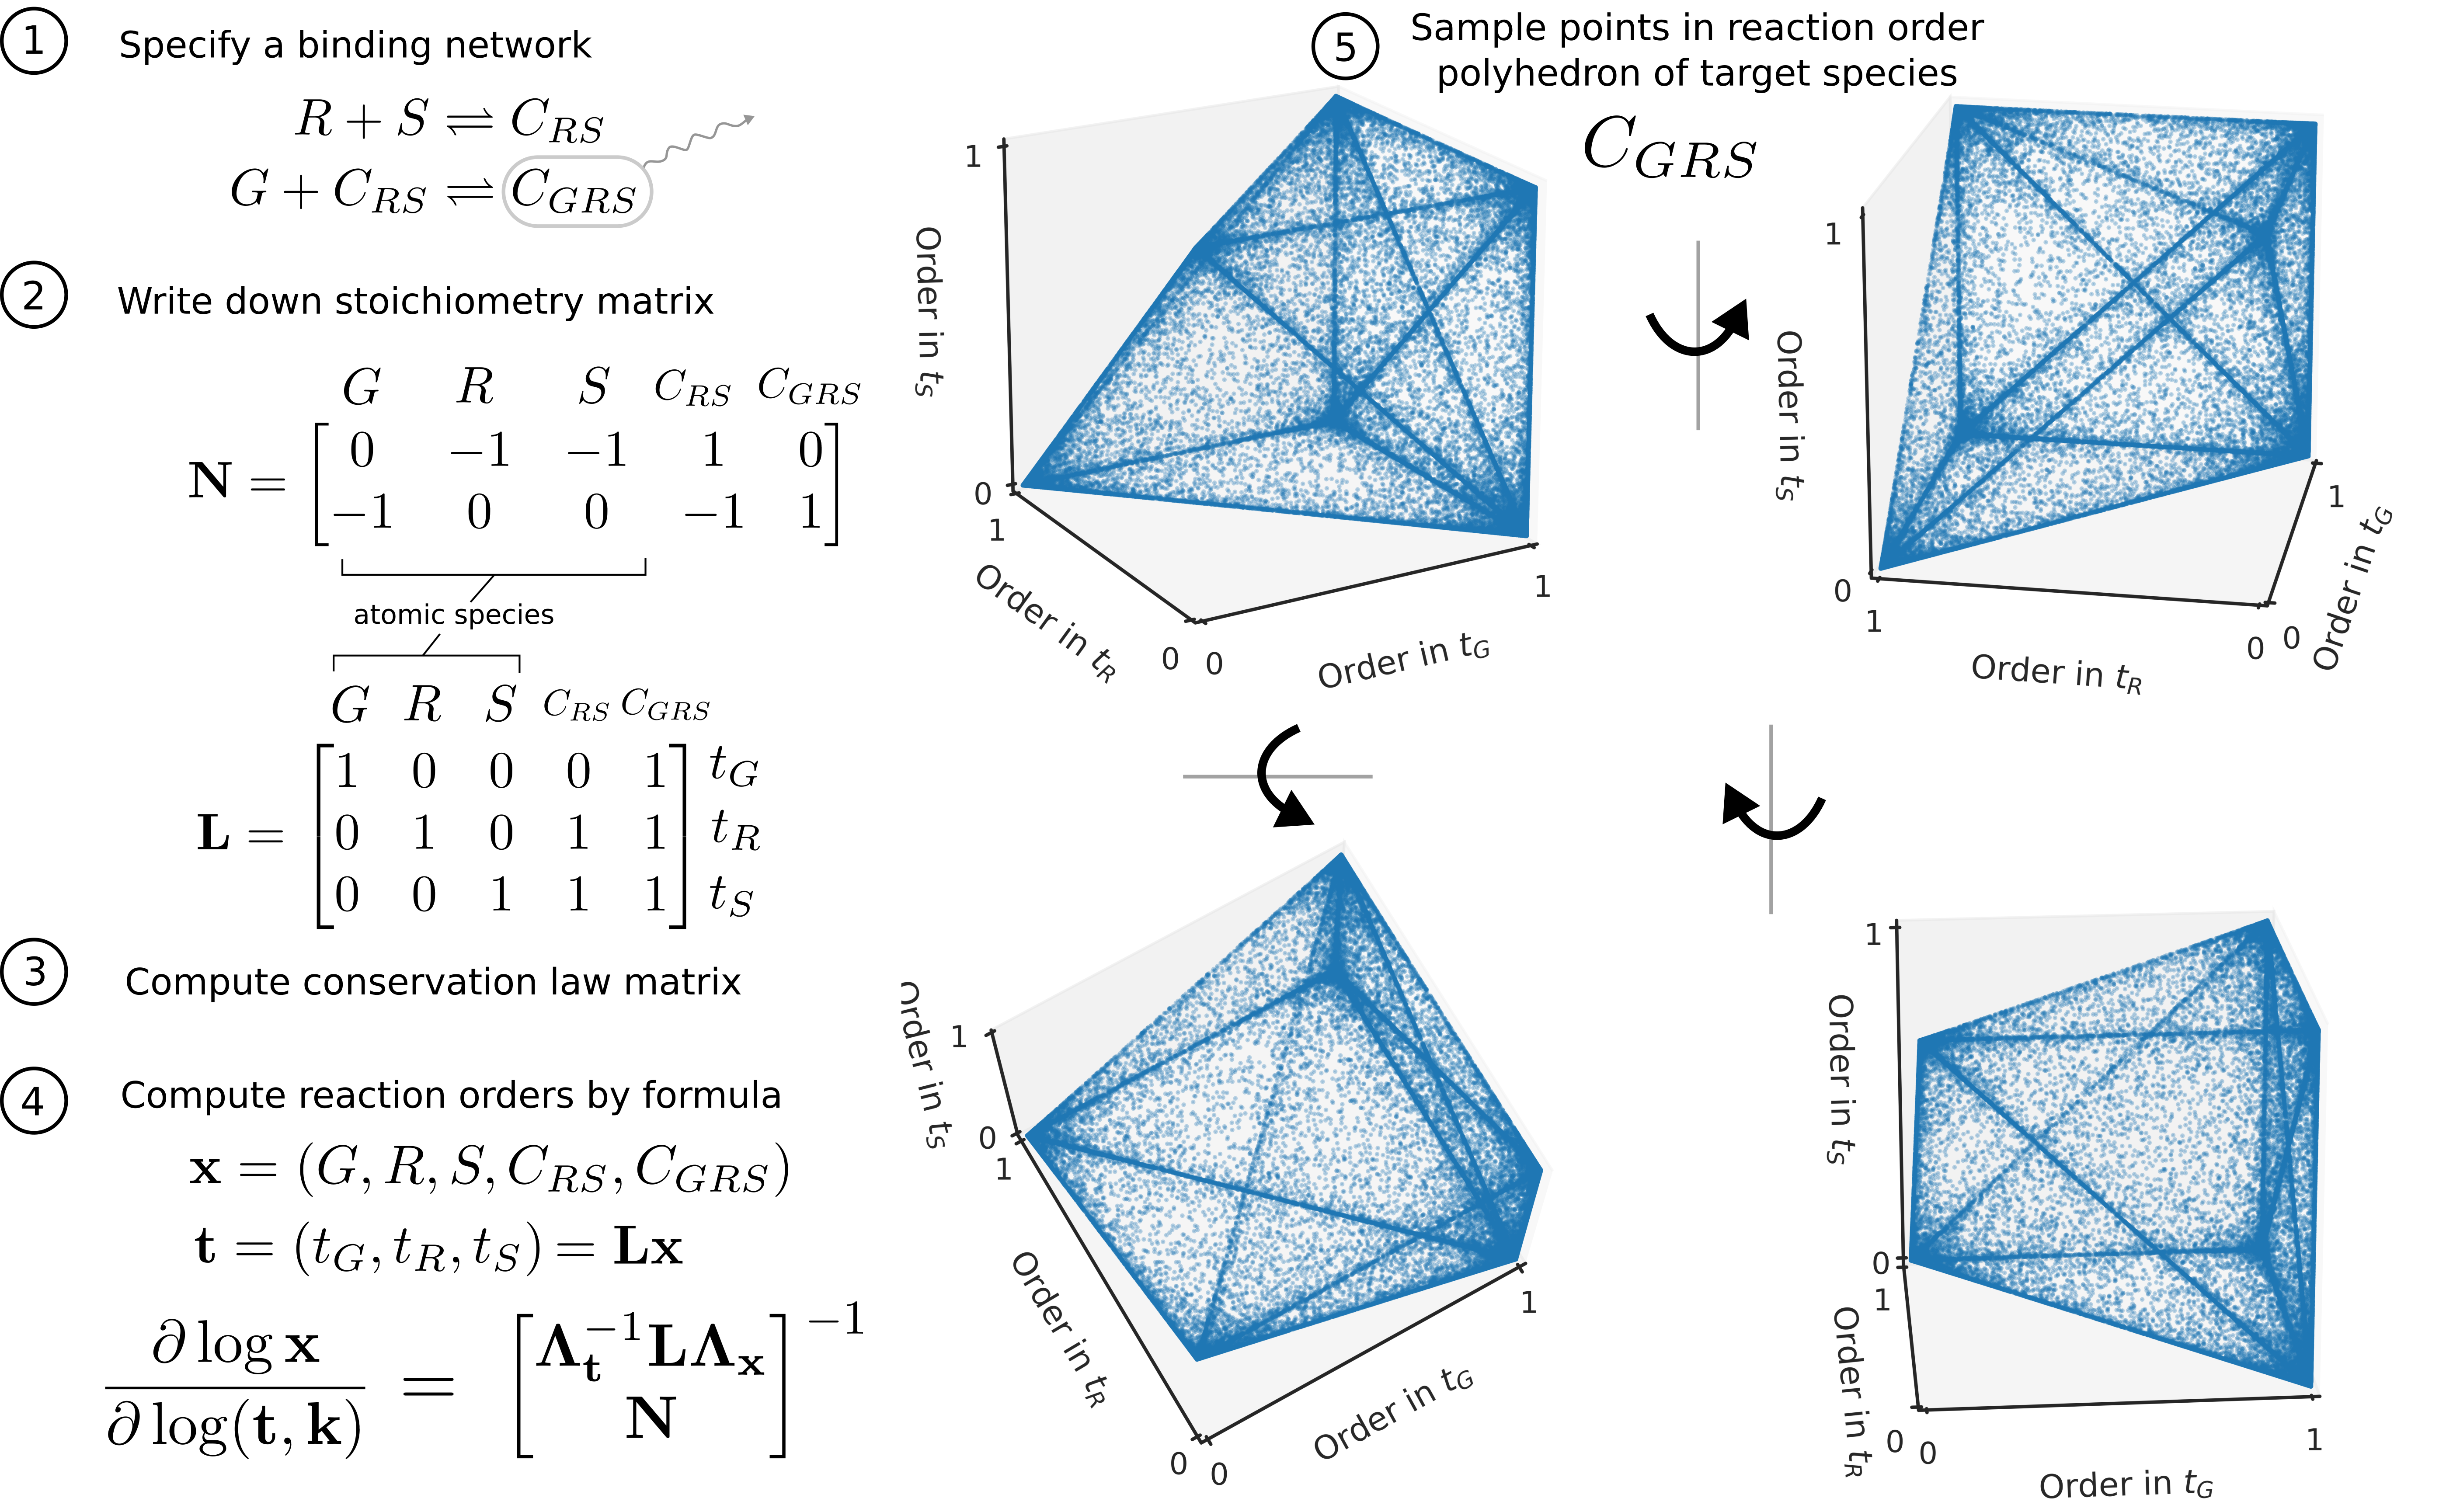
From the simple binding and catalysis network illustrated in the introduction page, we see that focusing on log derivative to capture holistic regulatory profiles can be achieved via implicit function theorem in this simple case. However, we would like to know whether this can be done in an analytical fashion for general detailed balanced networks. We are able to show that log derivatives of a detailed balanced (i.e. equilibrium) binding network can be calculated through the following explicit formula: \begin{equation} \label{eqn:log-der-formula} \frac{\partial \log x}{\partial \log t, \log k} = \begin{bmatrix} \Lambda_{t}^{-1} L \Lambda_{x} \\ N \end{bmatrix}^{-1}, \end{equation} where \(x \in \R^n\) is the vector of species’ concentrations, \(t \in \mathbb{R}^d\) is the vector of total concentrations, \(k \in \R^r\) is the vector of binding constants, one for each of the \(r\) binding reactions, with \(r+d = n\), and \(\Lambda_{x} \in \R^{n \times n}\) denote the diagonal matrix with \(x\) on the diagonal. \(N \in \R^{r \times n}\) is the stoichiometry matrix for the \(r\) binding reactions, and \(L \in \R^{d \times n}\) is the conservation law matrix so that \(t = L x\).
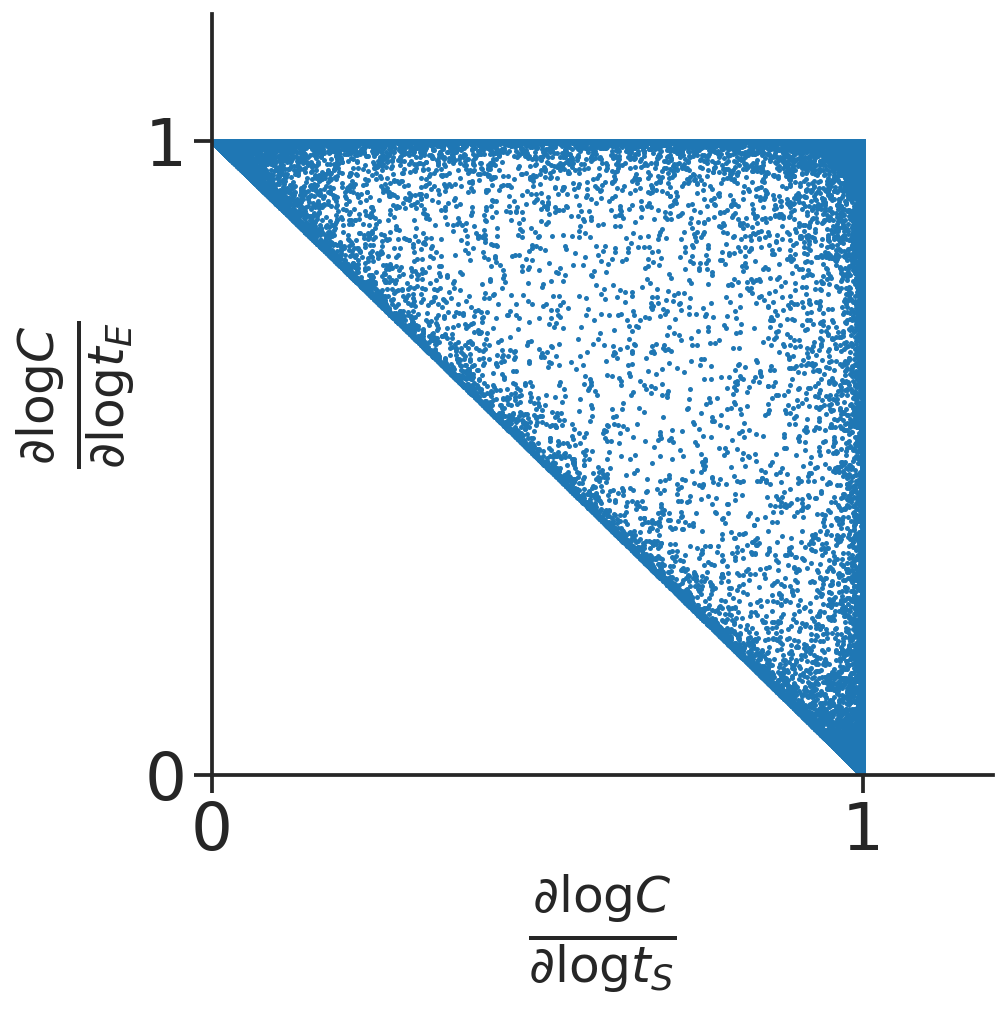
Formula \eqref{eqn:log-der-formula} enables us to symbolically compute the analytical expression of log derivatives in terms of \(x\). This in turns allows computational sampling of points in log derivative space to characterize the shape of the log derivative polyhedra. See figure below for sampling of log derivative of \(C\) in the simplest binding network \(E+S \rightleftharpoons C\).

See the following for an illustration of this procedure step-by-step on the binding network of induced activator with two binding reactions.

As one main motivation for using log derivatives is to characterize the holistic regulatory profile of catalysis rates, the goal of log derivative computation here is then to obtain the log derivative polyhedra that corresponds to the full regulatory profile. Although formula \eqref{eqn:log-der-formula} is useful for simulation and can be used to find the polyhedra by eye inspection of the sampling result, it is desirable to have a mathematical procedure that can directly obtain the polyhedra itself. Furthermore, such procedure should provide analytical insight into how such polyhedra arise in the first place, and reveal insight about how geometric features of the polyhedra correspond to biological meanings of the regulatory binding network.
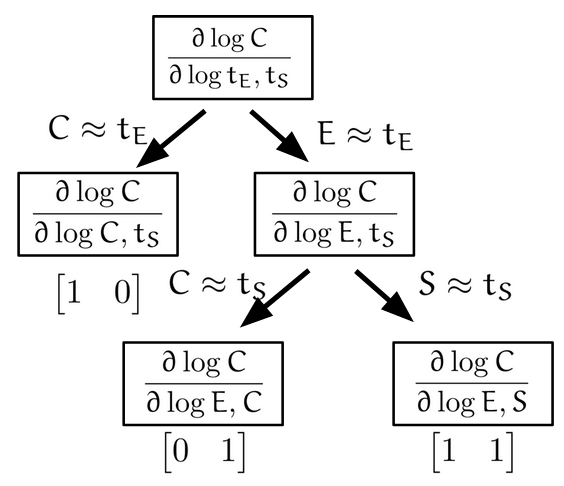
For this goal, we first consider the intuition behind why the log derivatives form polyhedra. Consider the triangular polyhedra for the simple binding reaction, we know the vertices (1,1), (1,0) and (0,1) arise at the extremes of concentrations. When substrate is overly abundant, since \(t_S = S+C\), we have the dominant form of the substrate molecule is the free form, i.e. \(S \approx t_S\). So from the steady state equation of binding we have \(C = \frac{ES}{K} \approx \frac{E}{K} t_S\). If we furthermore have that the dominant form of the enzyme is also the free form, \(E \approx t_E\), then we obtain \(C \approx \frac{t_E t_S}{K}\) corresponding to the (1,1) vertex. If we have \(C \approx t_E\) instead, that the dominant form of the enzyme is the bound form, then this corresponds to the (1,0) vertex, since the exponent is 1 in \(t_E\) and 0 in \(t_S\). Therefore, we see that the vertices of the log derivative polyhedra correspond to which species are dominant in the totals.
Based on this intuition, we may propose the following dominance decomposition tree (DDT) procedure to produce the triangular polyhedron in the simple binding case:

Below is an illustration of the step-by-step procedure of DDT for the induced activator example.

Now we would like to rigorously justify the DDT procedure so as to be generalizable to all relevant cases. The intuition behind the DDT procedure corresponds to the mathematical process of decomposing the log derivative operator. For example, instead of taking log derivative with respect to \((t_E,t_S)\), under the possible dominance conditions for \(t_E = E+C\), we decompose this log derivative operator into two log derivative operators, one with respect to \((C,t_S)\), and one with respect to \((E,t_S)\). We are able to study such decomposition procedure rigorously and found the following mathematical rule for general decompositions of log derivative operators:

Here \(\tilde D\) and \(\tilde \partial\) refer to log derivatives. This is a fundamental result on the calculus of positive variables. In the first case, the regular case, a log derivative operator is decomposable as a convex combination of the dominance extremes. In the second case, the singular case, a log derivative operator is decomposable as a ray from one dominance extreme going toward infinity along a direction determined by the singular dominance extreme.
This reveals that the fundamental reason that the holistic regulatory profile of binding reactions on catalysis rates take polyhedra form come from fundamental mathematical properties of log derivative operators, or the fundamental rules of calculus for positive variables. This further shows that the holistic regulatory profile in terms of log derivatives are truly structural, in the sense that it depends only on the stoichiometry of the binding network.
In summary, our mathematical investigation has revealed general formula for calculating log derivatives in binding networks, or directly calculating the polyhedra of holistic regulatory profiles. Furthermore, we have related bioregulation to fundamental rules of calculus for positive variables.